Capital Goods New Orders as an Economic Activity Indicator: How They Compare to Gross Private Investments

Capital Goods New Orders as an Economic Activity Indicator: How They Compare to Gross Private Investments
- By Serge Narkevich
In my previous article I reviewed the definitions of capital goods and related concepts (available here). Now it is time to elaborate on why capital goods data serve as an important economic indicator.
Naturally, capital goods are closely connected to the investments made in the economy. So data on capital goods work as a signal on understanding how investments are going to behave. Several ideas need to be taken into consideration in order to decode the usefulness and popularity of this metric in macroeconomic and investment analysis.
Established methodology. The Manufacturing survey data has been published since 1957. While changes to the statistical approach happen, the overall nature of the statistic and its clarity to the users stay virtually immutable. It is worth noting that the data comes in both seasonally adjusted and non-adjusted variants.
Data Frequency. The monthly release of the capital goods statistic allows receiving new data points for analysis quicker. This comes favorably when compared to the GDP and gross investments data issued quarterly and prone to revisions. It is also crucial that the capital goods new orders data come in a regular manner: typically at the start of every month and with an advance report available approximately a week earlier.
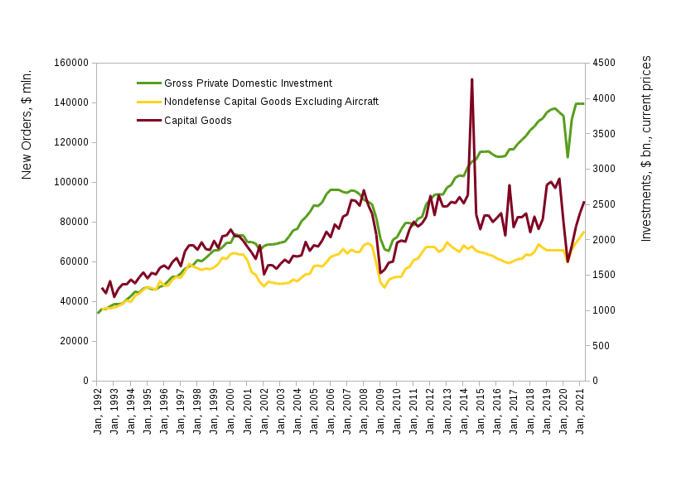
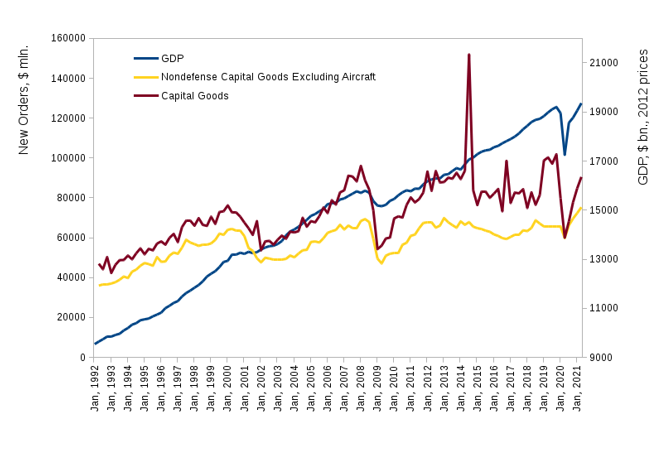
High correlation with gross investments. The most prominent advantage of the capital goods new orders survey is the possibility of using it to make reasonable inferences and forecasts. It is related to both economic activity in general and the developments of investments in the economy. For illustration in the charts below two capital goods indicators are shown with the US GDP and gross private investments. While confirming the link requires a more formal statistical approach to be employed, the co-integration of the line graphs can be visibly noticed. It works better for the investments than for the GDP, but the connection is very close with the only period performing relatively poorly being between 2016 and 2018.
Wide choice of metrics. Any researcher using the capital goods new orders indicator can choose from several possible variants of the statistic that fits the analysis best. The most commonly employed option is nondefense capital goods excluding aircraft as it omits new orders of both capital goods bought by the government entities (thus allowing to more precisely analyze private investments) and aerial vehicles which are very volatile.
Overall, the capital goods new orders data offers a possibility to closely watch and predict investment activity in the economy as well as providing a number of research options for analysis.