Recent Capital Goods Data and Its Implications for the Investments

Recent Capital Goods Data and Its Implications for the Investments
- By Serge Narkevich
Here I follow my two recent pieces on the capital goods statistic from the Manufacturers' Survey. What is the capital goods connection to the gross private domestic investments? I try to further develop my understanding of how capital goods data can be used to forecast and understand the behavior of US investments. For an excellent descriptive analysis of the recent capital goods trends please visit www.advisorperspectives.com (here).
Model and data
So, in this article I try to use a simple model that makes the US investment forecast based on the two variables:
- non-defense capital goods excluding aircraft;
- durable goods.
Data is quarterly. The model uses the first year-over-year difference of all the data series. I run a multiple regression on these first differences of the time series. On the chart you can see the predicted value versus the actual values. The Q2 2022 investments are forecast based on the capital goods May data.
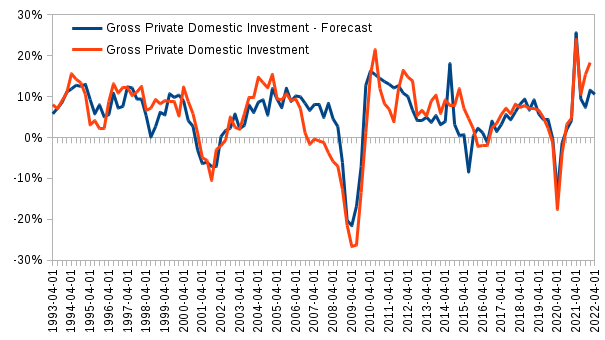
The recent forecast discrepancy
The forecast is fairly good with the R squared being 68%. It is especially in the period since 2015-16. However, in the last couple of quarters the investment actual data significantly parts from the forecasted values. In particular, it was significantly above the forecast. Naturally, I tried to make several conjectures about the possible reasons of this forecast versus the actual values disparity.
The disparity reasons
First, the aircraft orders data is not included in the non-defense capital goods series used in the model. So, recently, after the Coronavirus epidemic was declared widely over and the transport traffic has been returning to the pre-pandemic levels, the production of aircraft should be significantly on the rise.
Second, maybe there was some rise in defense capital goods production. Taking into account the recent hostilities that started between Russia and Ukraine, and the significant amount of deliveries that were started in February by the US government. The investment data is available just for the first quarter. So, this defense spending could be not yet reflected in the data.
The third possible reason is that there could be a significant rise in buildings and structures construction. Both residential and commercial properties. These data are not included in the capital goods orders series. Consequently, housing and commercial construction could have influenced the investment data raising it significantly above the forecast values.
In conclusion, these are just my hypotheses on the actual vs. forecast values disparity. They need to be checked. There will be a separate article on this. Finally, please be aware of the fact that much more factors could be at play. So take this forecast with a grain of salt and be really cautious making predictions using this piece of data.